I have had a chance to get back to tuning my car and thought you might be interested in this Fuel Spectrograph. It might clear up a few thoughts your having with your own car.
Firstly, this “Fuel Spectrograph” was developed by my son when he was 12, I told him then no more playing computer games and do something useful. We worked together developing tuning tools for 12 years. He is 32 now and I am still using this tool and yes he is still playing computer games.
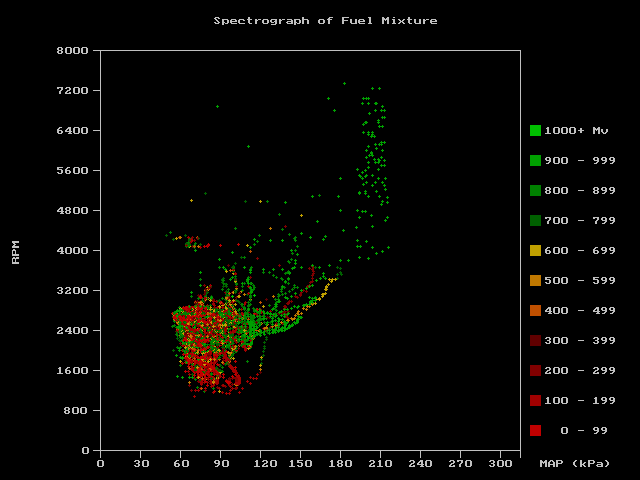
The legend on the right with the different colours represent the standard (narrow band) oxygen sensor voltages. Rpm and kPa are shown on the two axis. The many coloured dots are collected over a 10 minute spirited drive.
In my case I have set my waste gate control at 210 kpa which is approx a little over 15psi boost. You can see where waste gate is active in the top section of the spectrograph where the RPM is rising.
What does it all mean: The same two axis in the spectrograph are the same in our VE tuning table so what we see above is the result of the current tune from adjustments that have made to the VE table within the ecu.
The question you asked. Will it be safe to manually change boost levels at different rpm and boost points. The answer is unknown. It will depend if the previous tuner has covered all the plotting points on the VE table with different boost levels. This is very seldom done as it would be very time consuming.
You will notice most of the area in the spectrograph is black and therefor never visited. Keep in mind you can only tune accurately in areas that get visited. A good tuner will understand the possibility that boost levels may be altered and adjust the VE table to look to what he/she sees fit.
Yes I do log with a wideband sensor as well as the factory oxygen sensor so if anyone is interested I could put up a few more graphs.
post edited by kojab - 2014/10/20 13:17:28